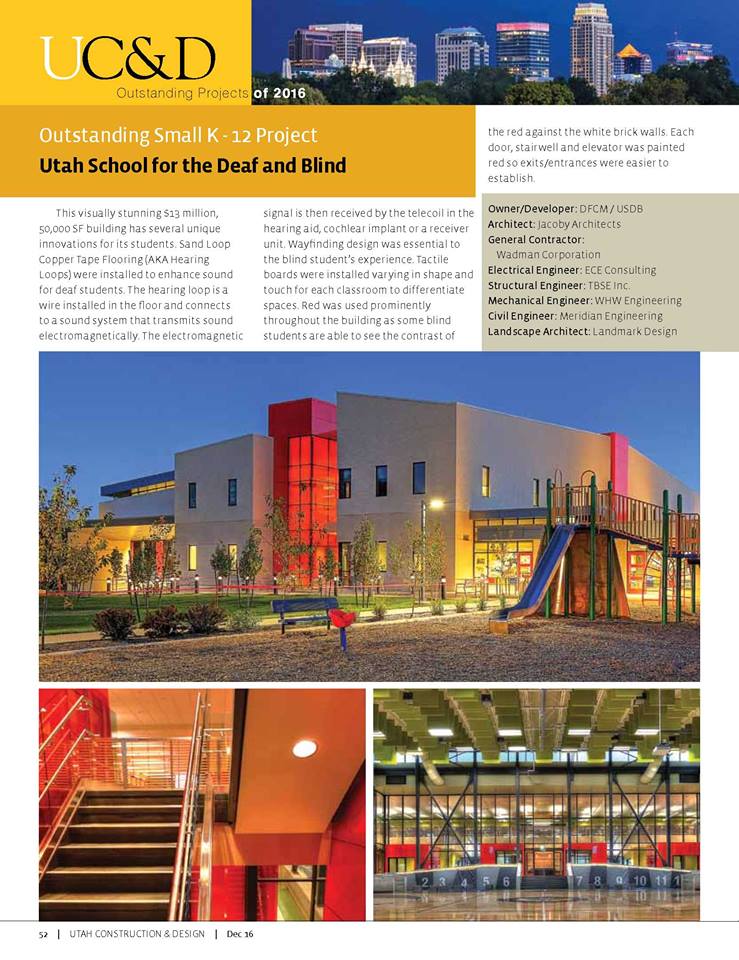
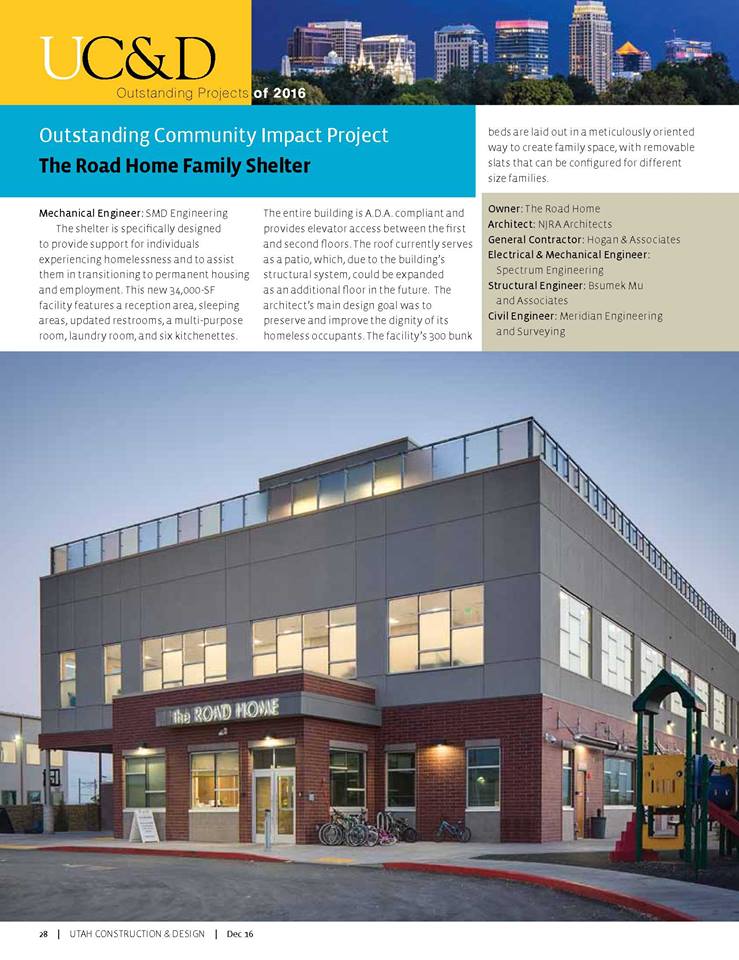
Utah Construction & Design has come out with their 2016 Outstanding Project Awards, and Meridian was recognized—twice.
Congratulations to Nichole Luthi and her team for these achievements!
Utah Construction & Design has come out with their 2016 Outstanding Project Awards, and Meridian was recognized—twice.
Congratulations to Nichole Luthi and her team for these achievements!
Thank you to everyone who helped us win the LiDAR as Art contest! Thanks especially to the team who captured the scan: Jeff Searle, Marshall Burt, and Brian Boehmer! The news of our victory can be found here.
The team at LiDAR News asked us to write an article about the experience, and we gladly did. The article, “LiDAR to Perpetuate Beauty,” can be found here.
Thanks again! We are so excited that we won!
When it comes to services rendered, Meridian is unmatched. When it comes to winning contests, Meridian is also unmatched. What can we say? We really enjoy winning.
Meridian entered LiDAR News’ annual “LiDAR as Art” contest. This year’s theme is Winter Solstice, and LiDAR manager Jeff Searle knew just what to scan: The Sun Tunnels.
Designed by artist Nancy Holt, the Sun Tunnels are a set of four massive concrete tubes. On the Summer and Winter Solstices, two tunnels line up to frame the sunrise and the other two tunnels line up to frame the sunset. We are a couple weeks early for the Winter Solstice, but we got some great images anyway.
Jeff, Tiana Moe, Marshall Burt, and Brian Boehmer spent hours scanning the Sun Tunnels from every angle to ensure we’d get the best image possible. After a bit of rendering and a touch of color, our entry was submitted.
Today we found out that we are finalists in the LiDAR as Art contest! Now we need your help to snag the win. Or completely dominate the contest—we aren’t picky.
Go to the link below and vote for Sun Tunnels. This is an international contest with some good contenders, and we need to show the world that our little corner of the world has unparalleled beauty.
http://lidarnews.com/articles/lidar-art-contest-finalists/
Below are some pictures of the Sun Tunnels, including our submitted image.
Stay tuned for a full account of our adventure that will be published on LiDAR News’ website!


The UDOT Conference, which took place November 1-3, was quite the event, filled with fun, friends, and fantastic food. Our Meridian team benefited greatly from the available classes, and we were able to catch up with old colleagues and make some new ones as well.
Here are some photos of the event. We’ve already got big plans for next year!
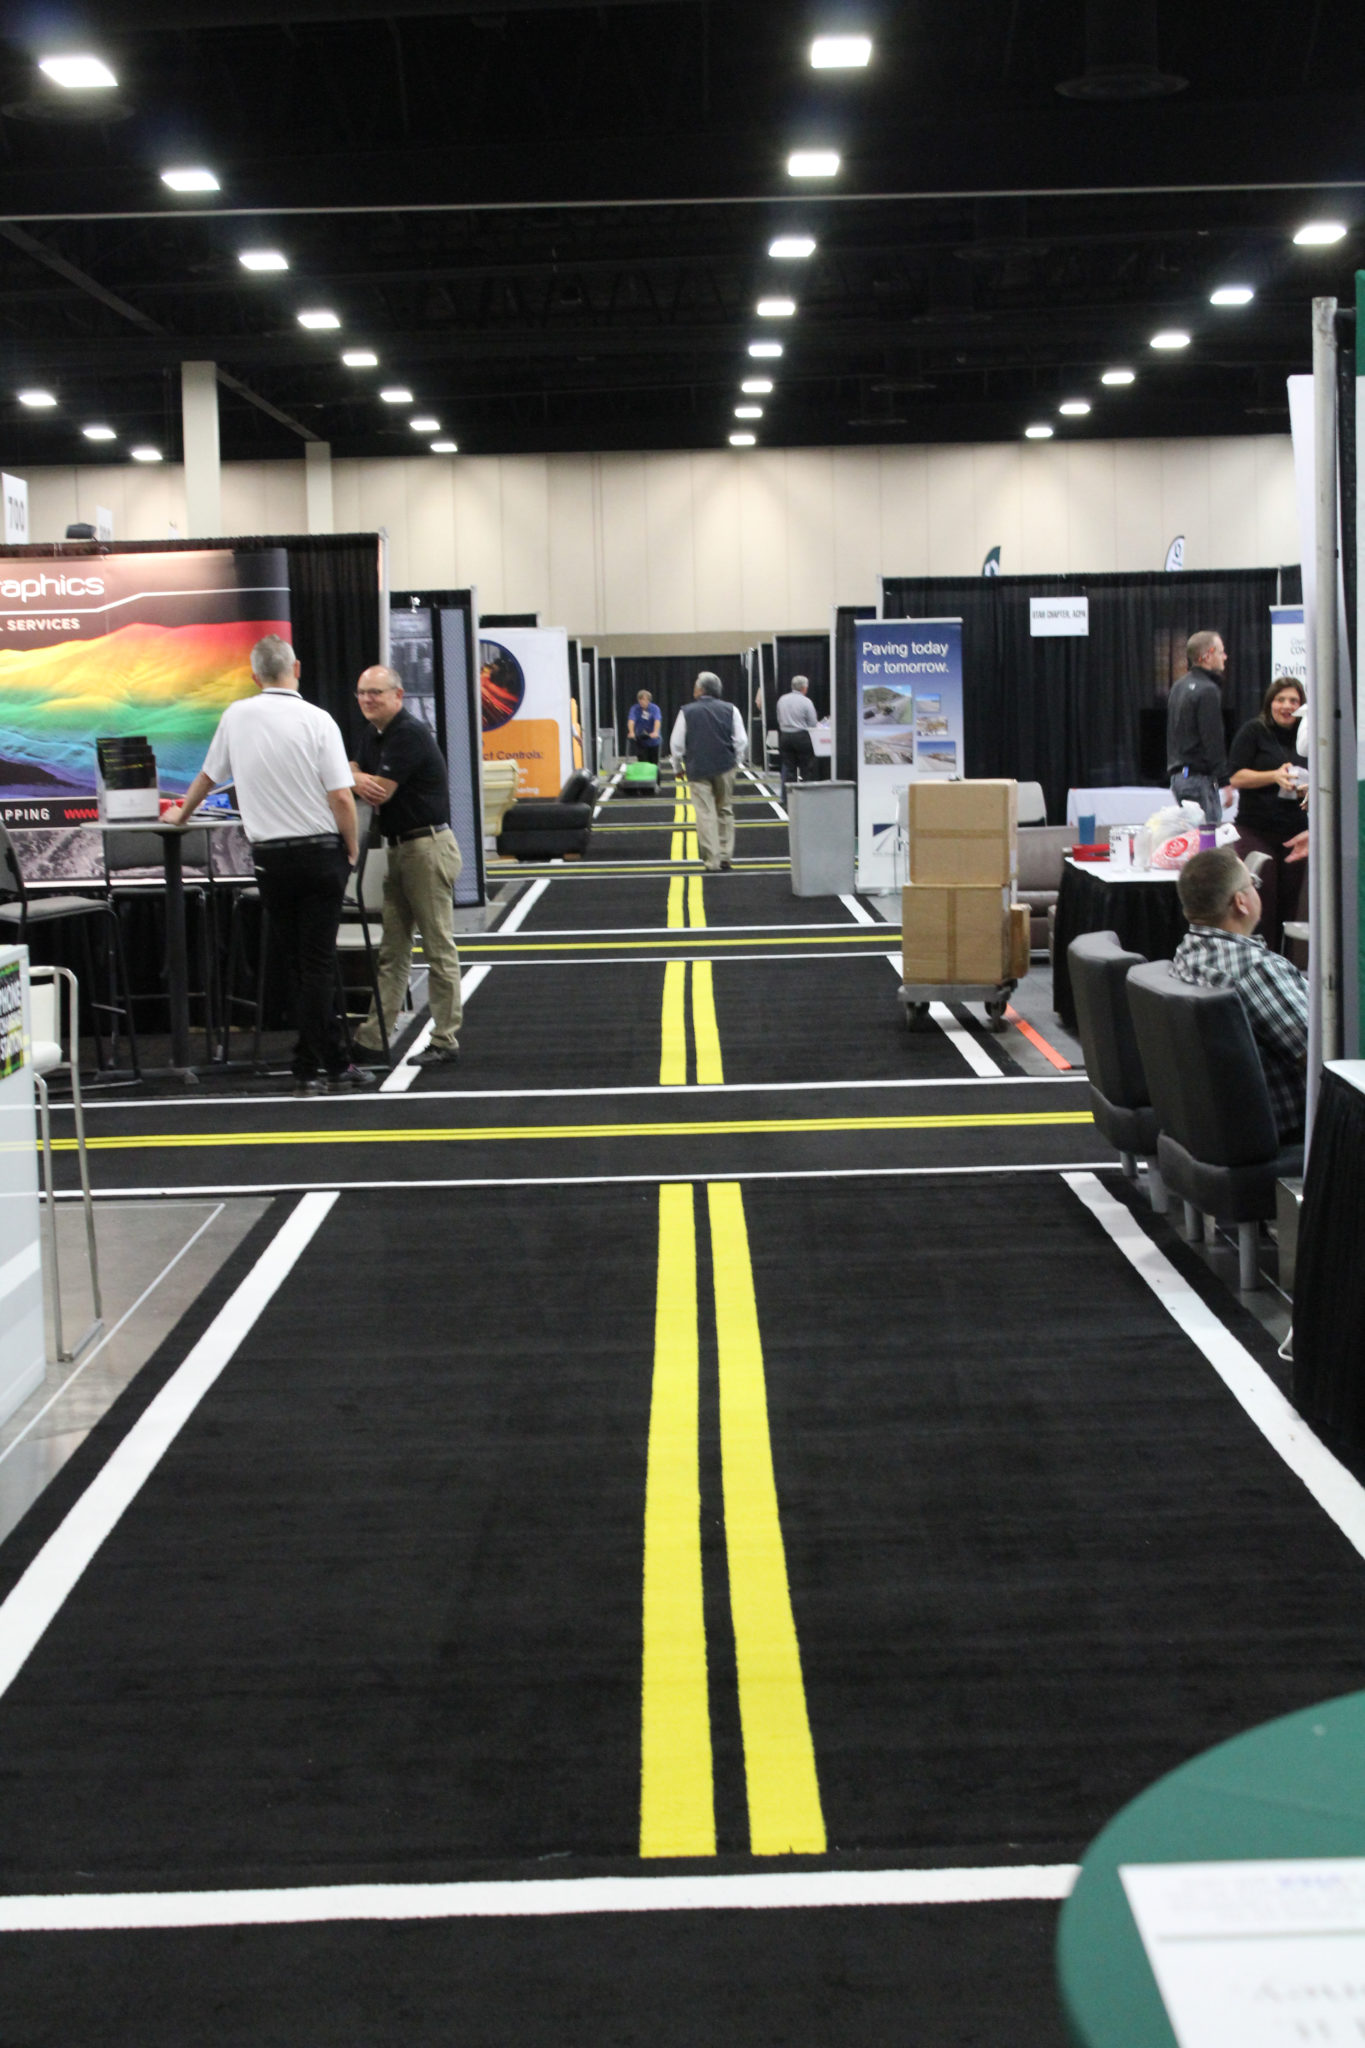
Right before the hustle and bustle.
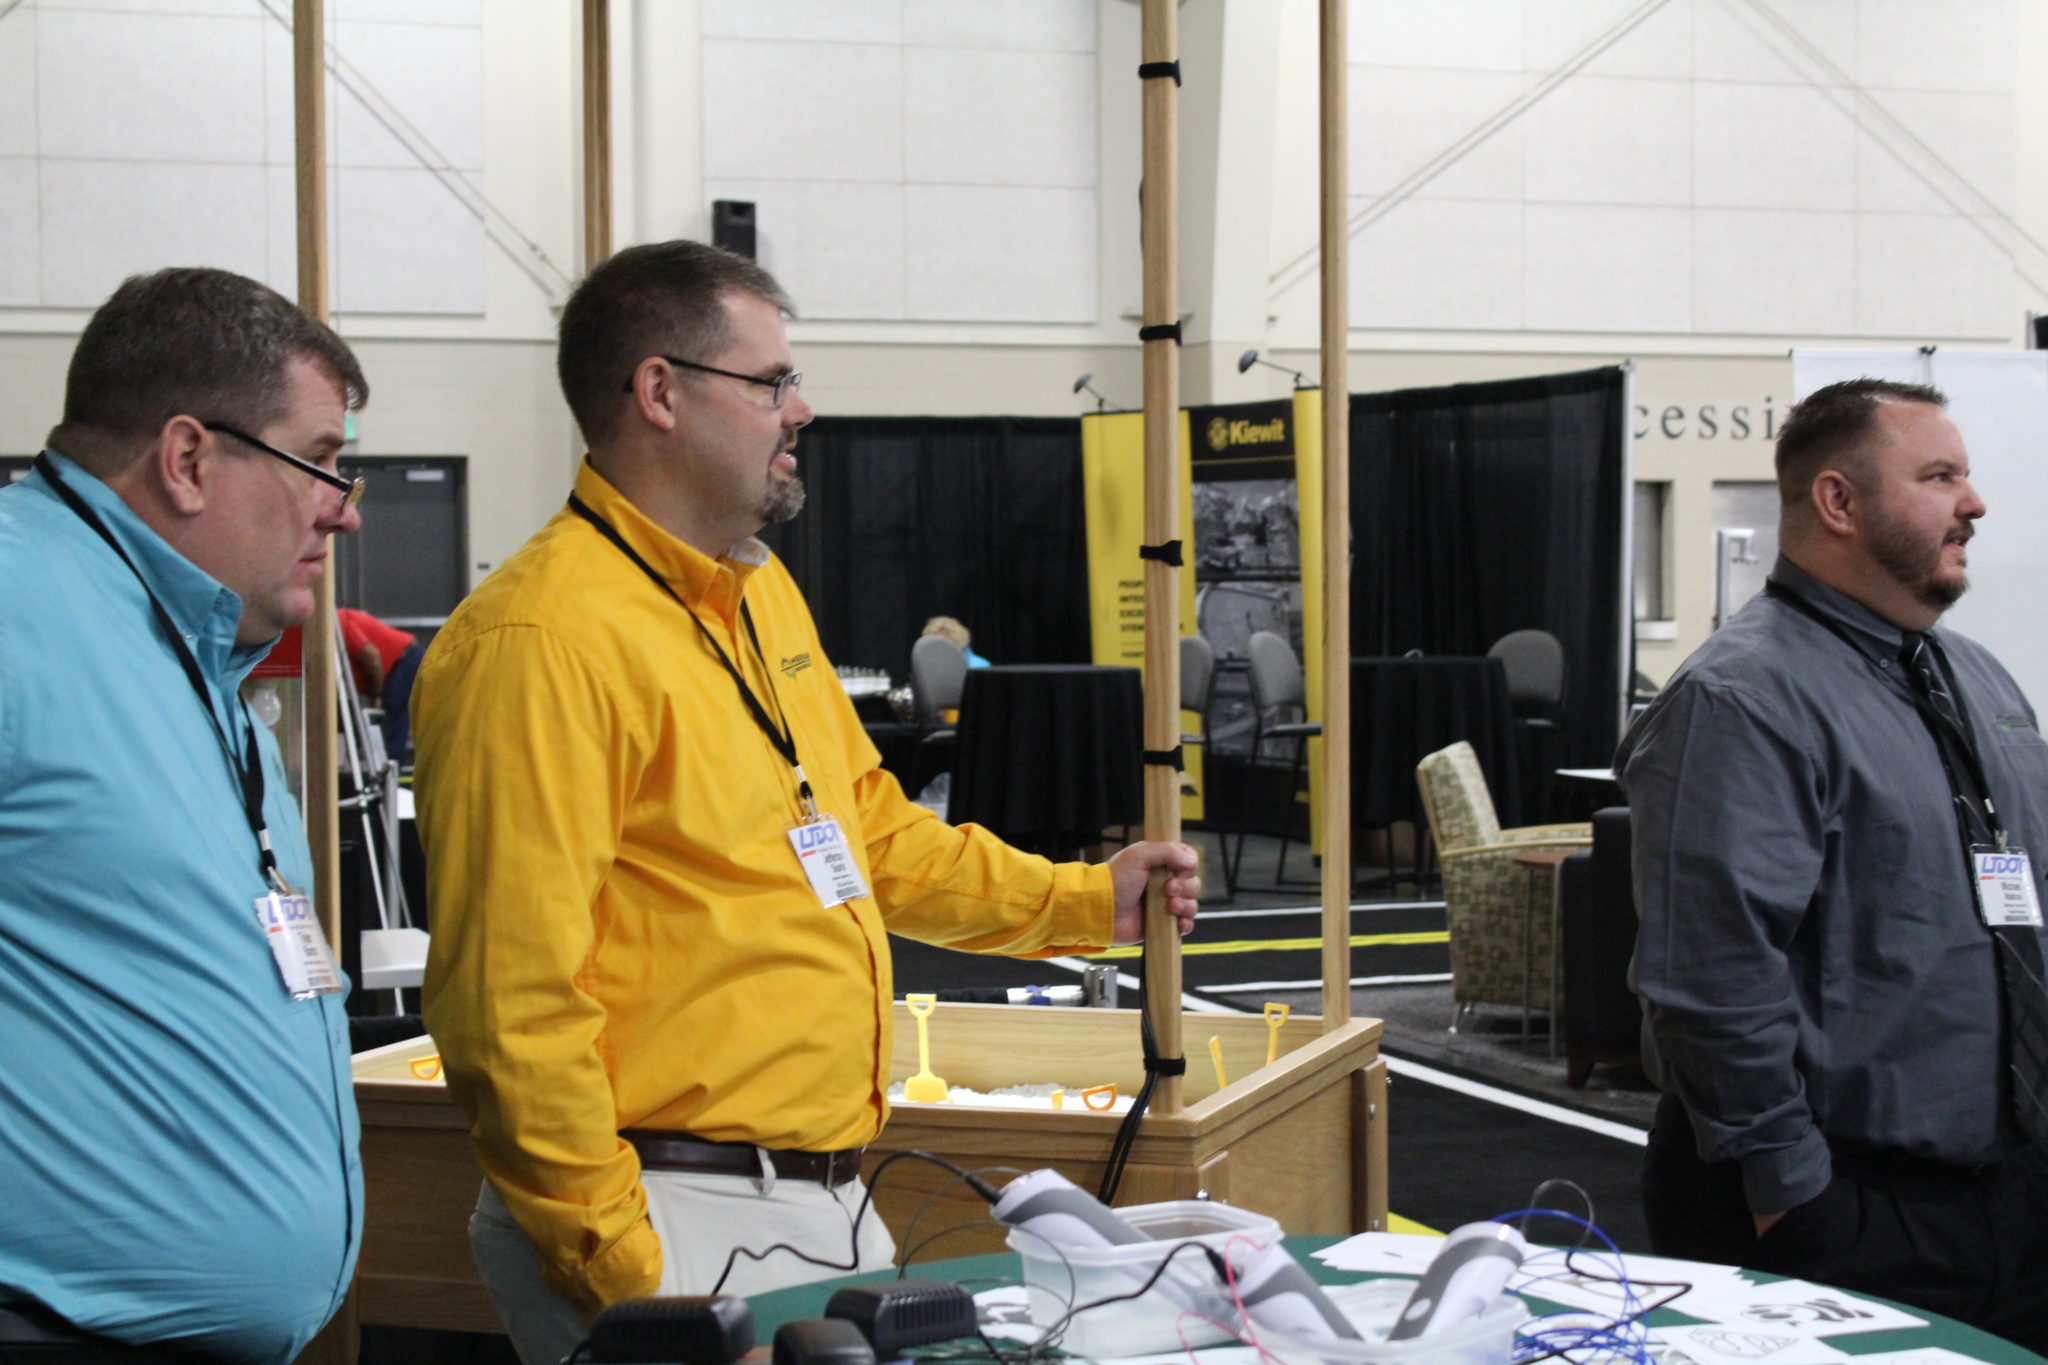
Tyler, Jeff, and Mike, looking great as always.

Mike Timothy made some fashionable glasses using a 3D pen.
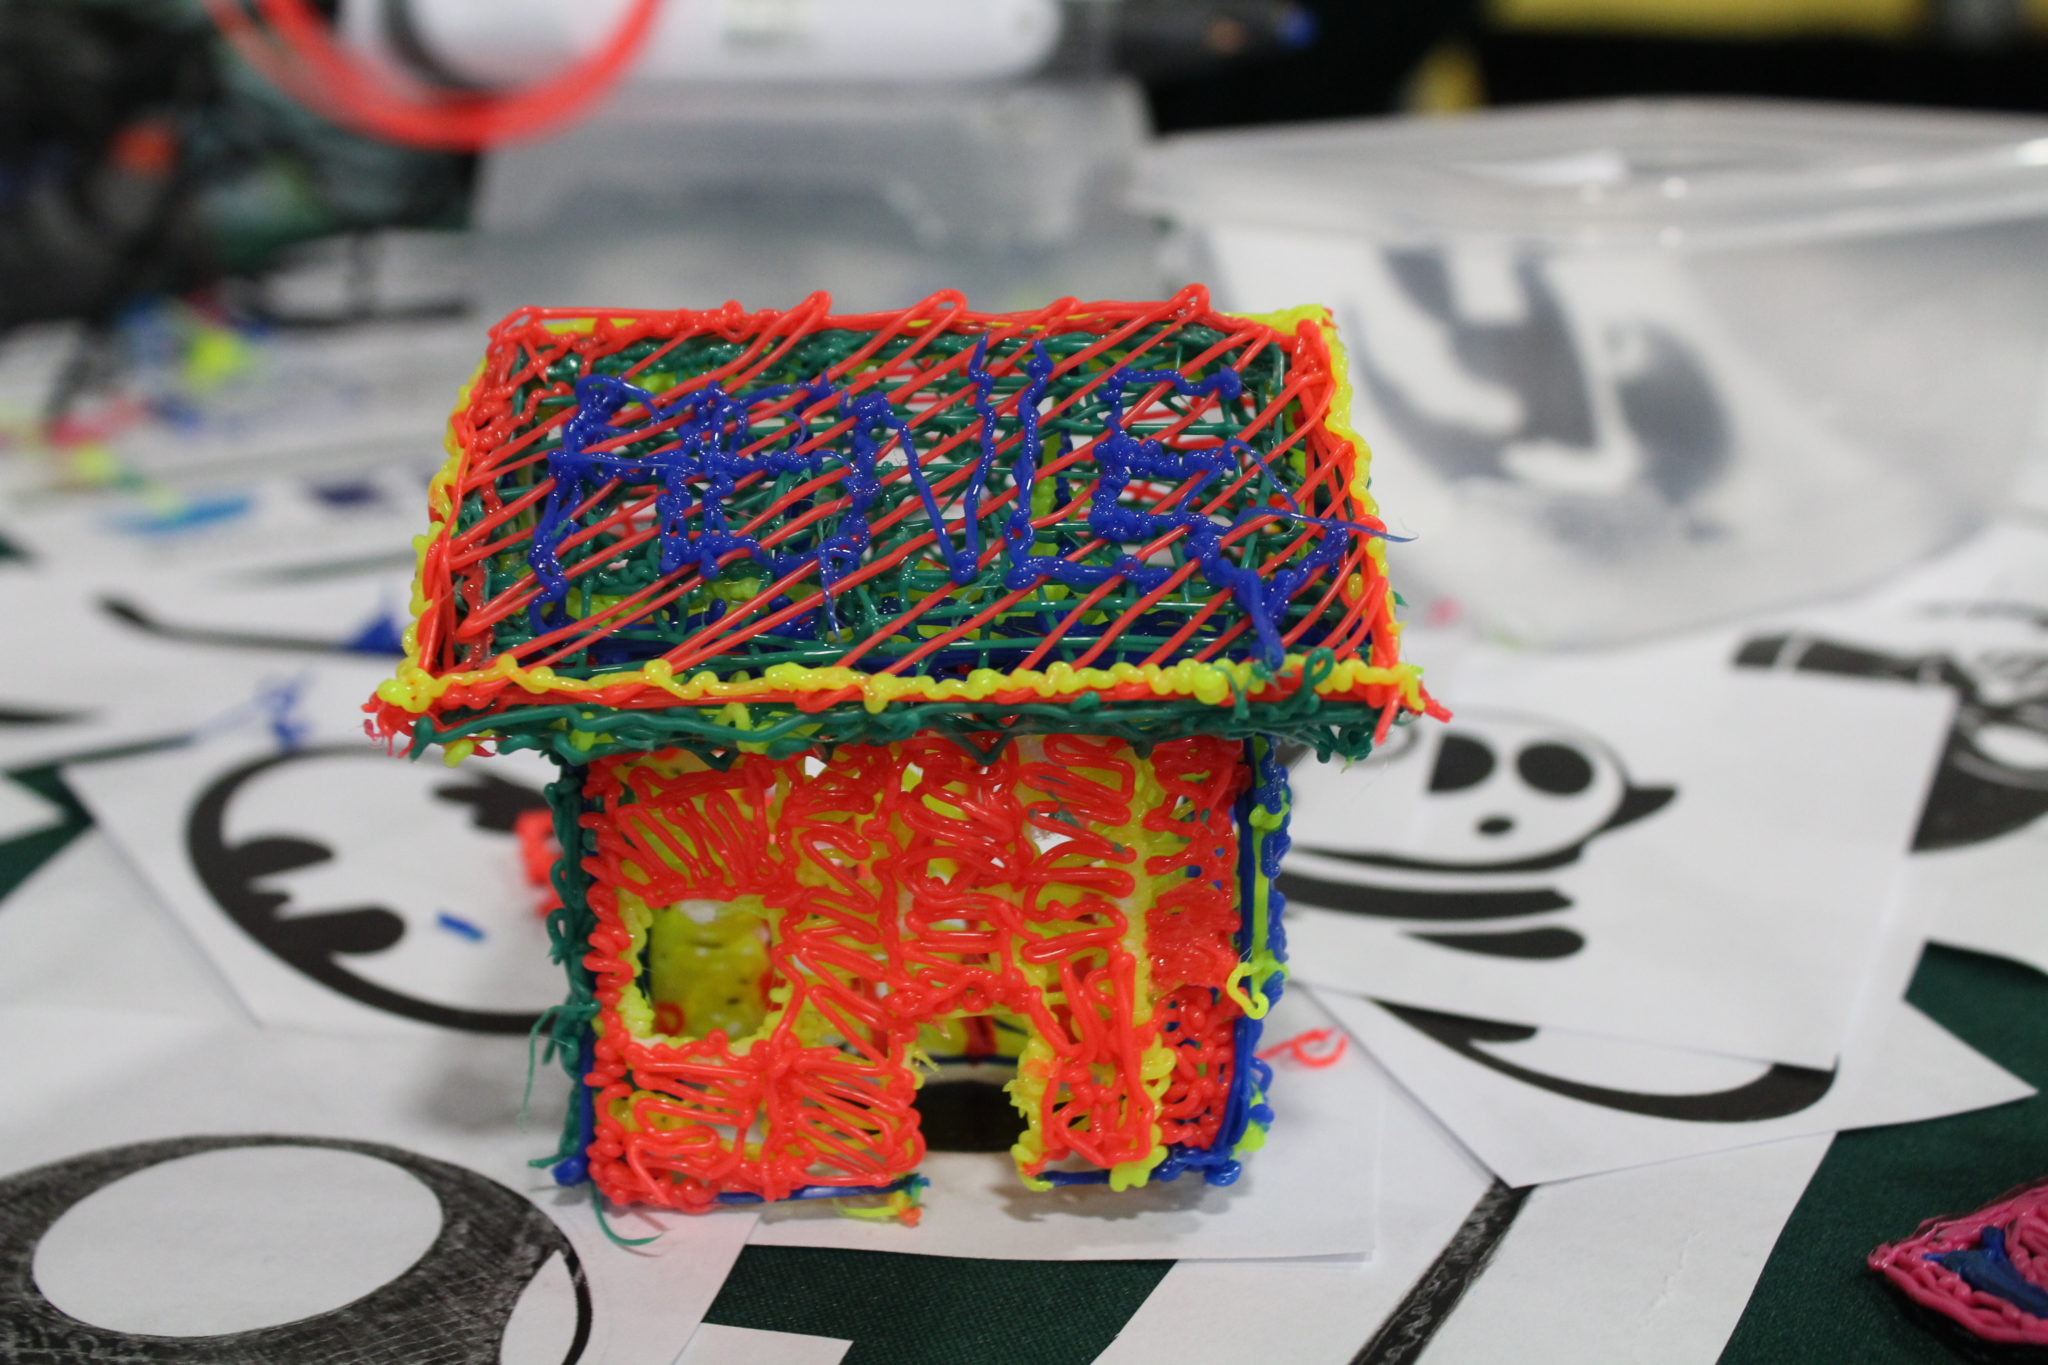
Jason Henley spent three hours constructing this masterpiece.
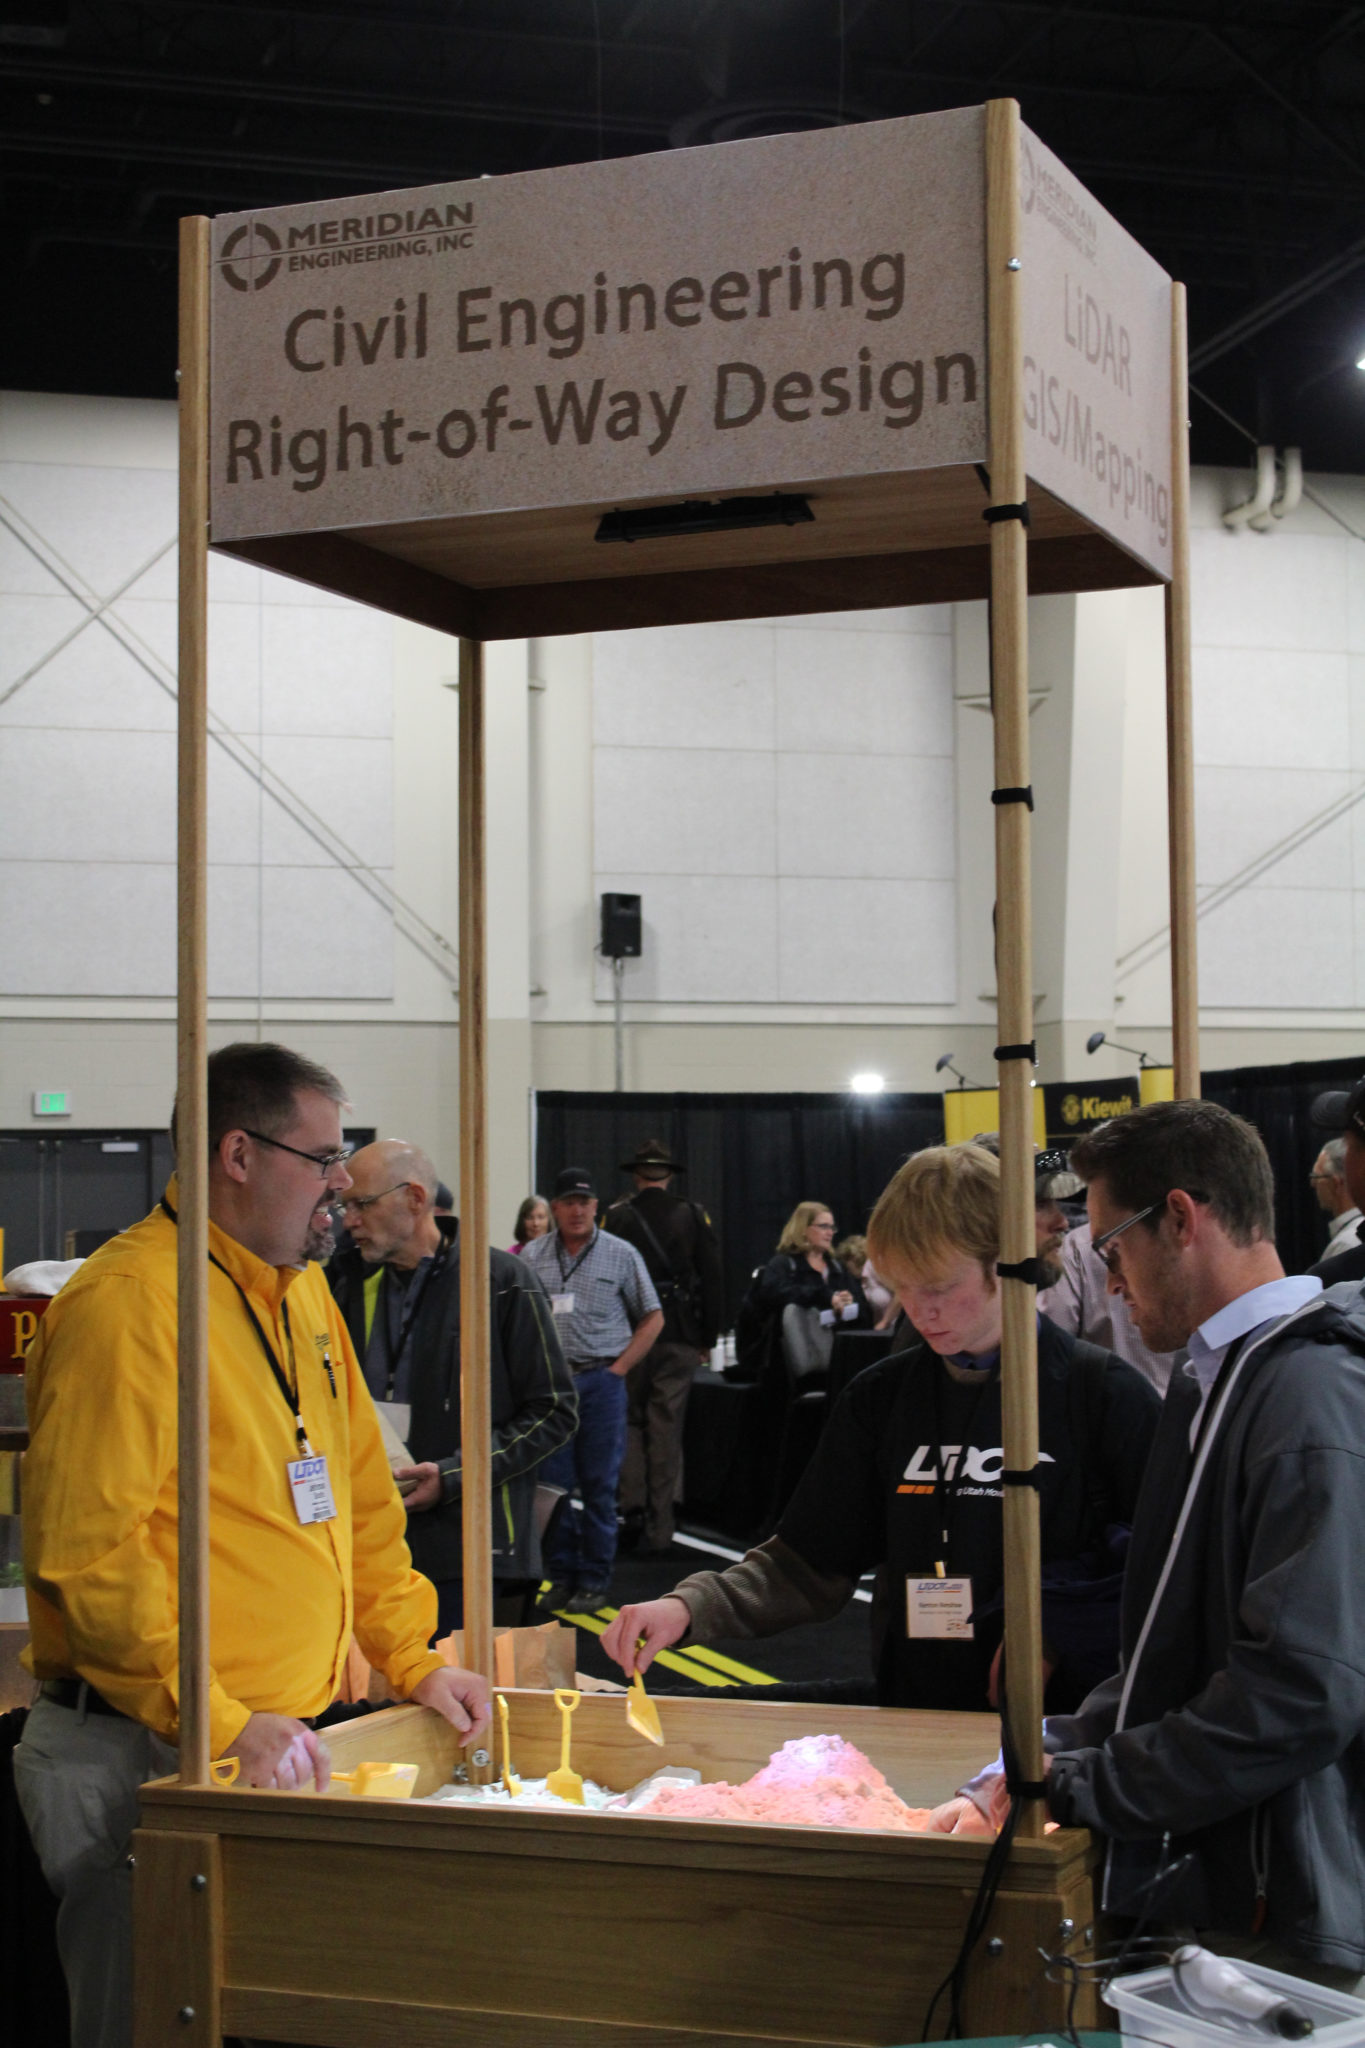
Playing with the sandbox.

Vic Saunders was a balancing champion.

My eyes said yes but my stomach said oh, no.
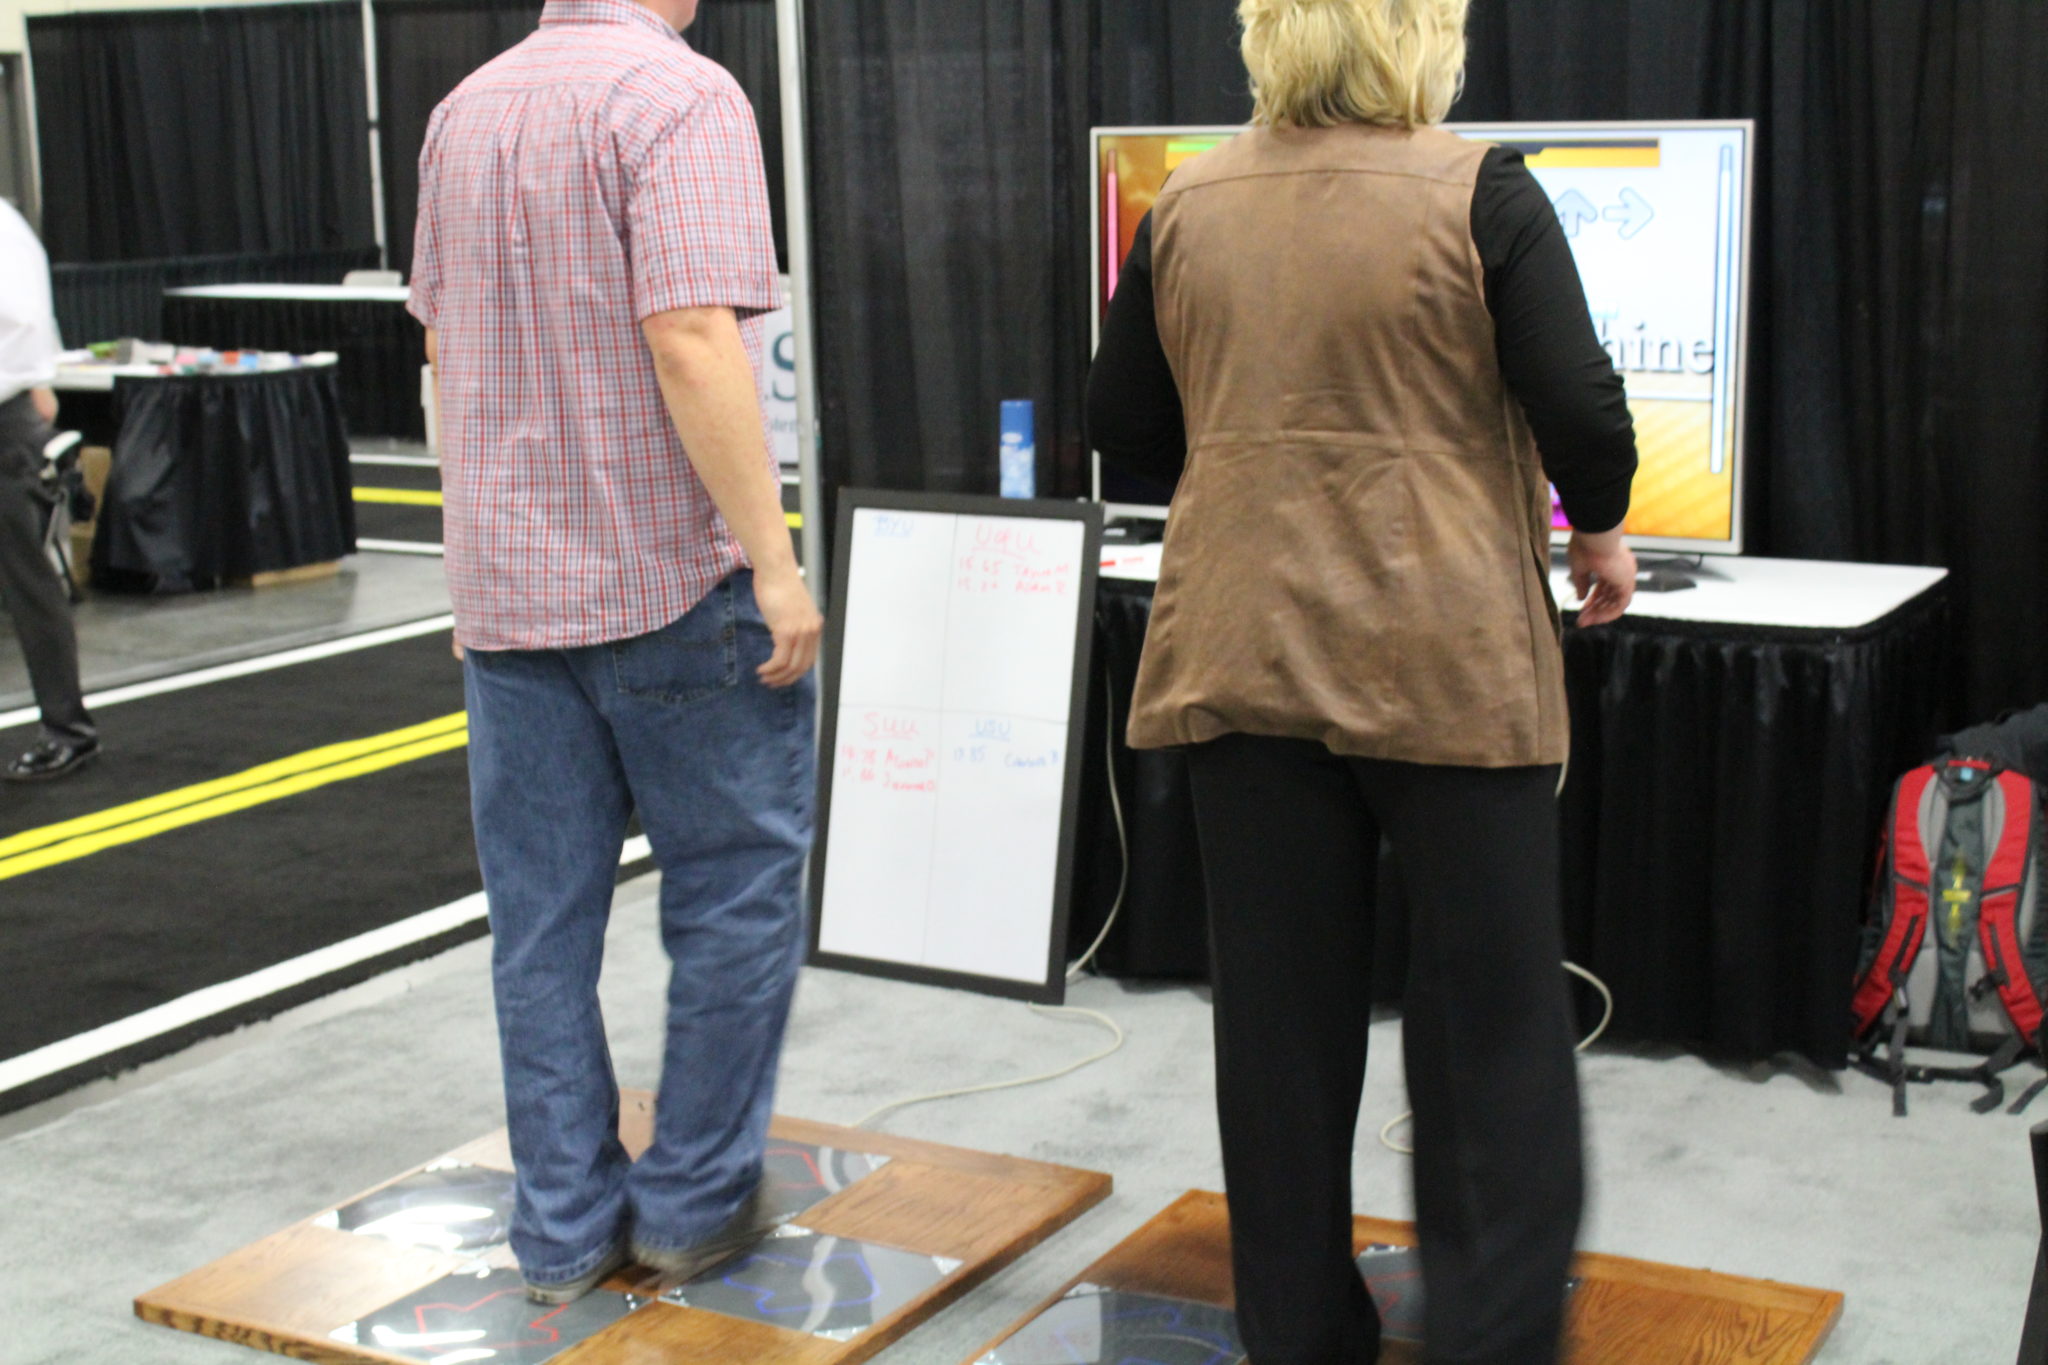
Some of us got our groove on.

Nichole briefly participated in No Shave November.

…so did Jennifer Avila.

Mike Timothy came back for round two, this time to make a monocle.

Doesn’t Dian McGuire look awesome in her new glasses?
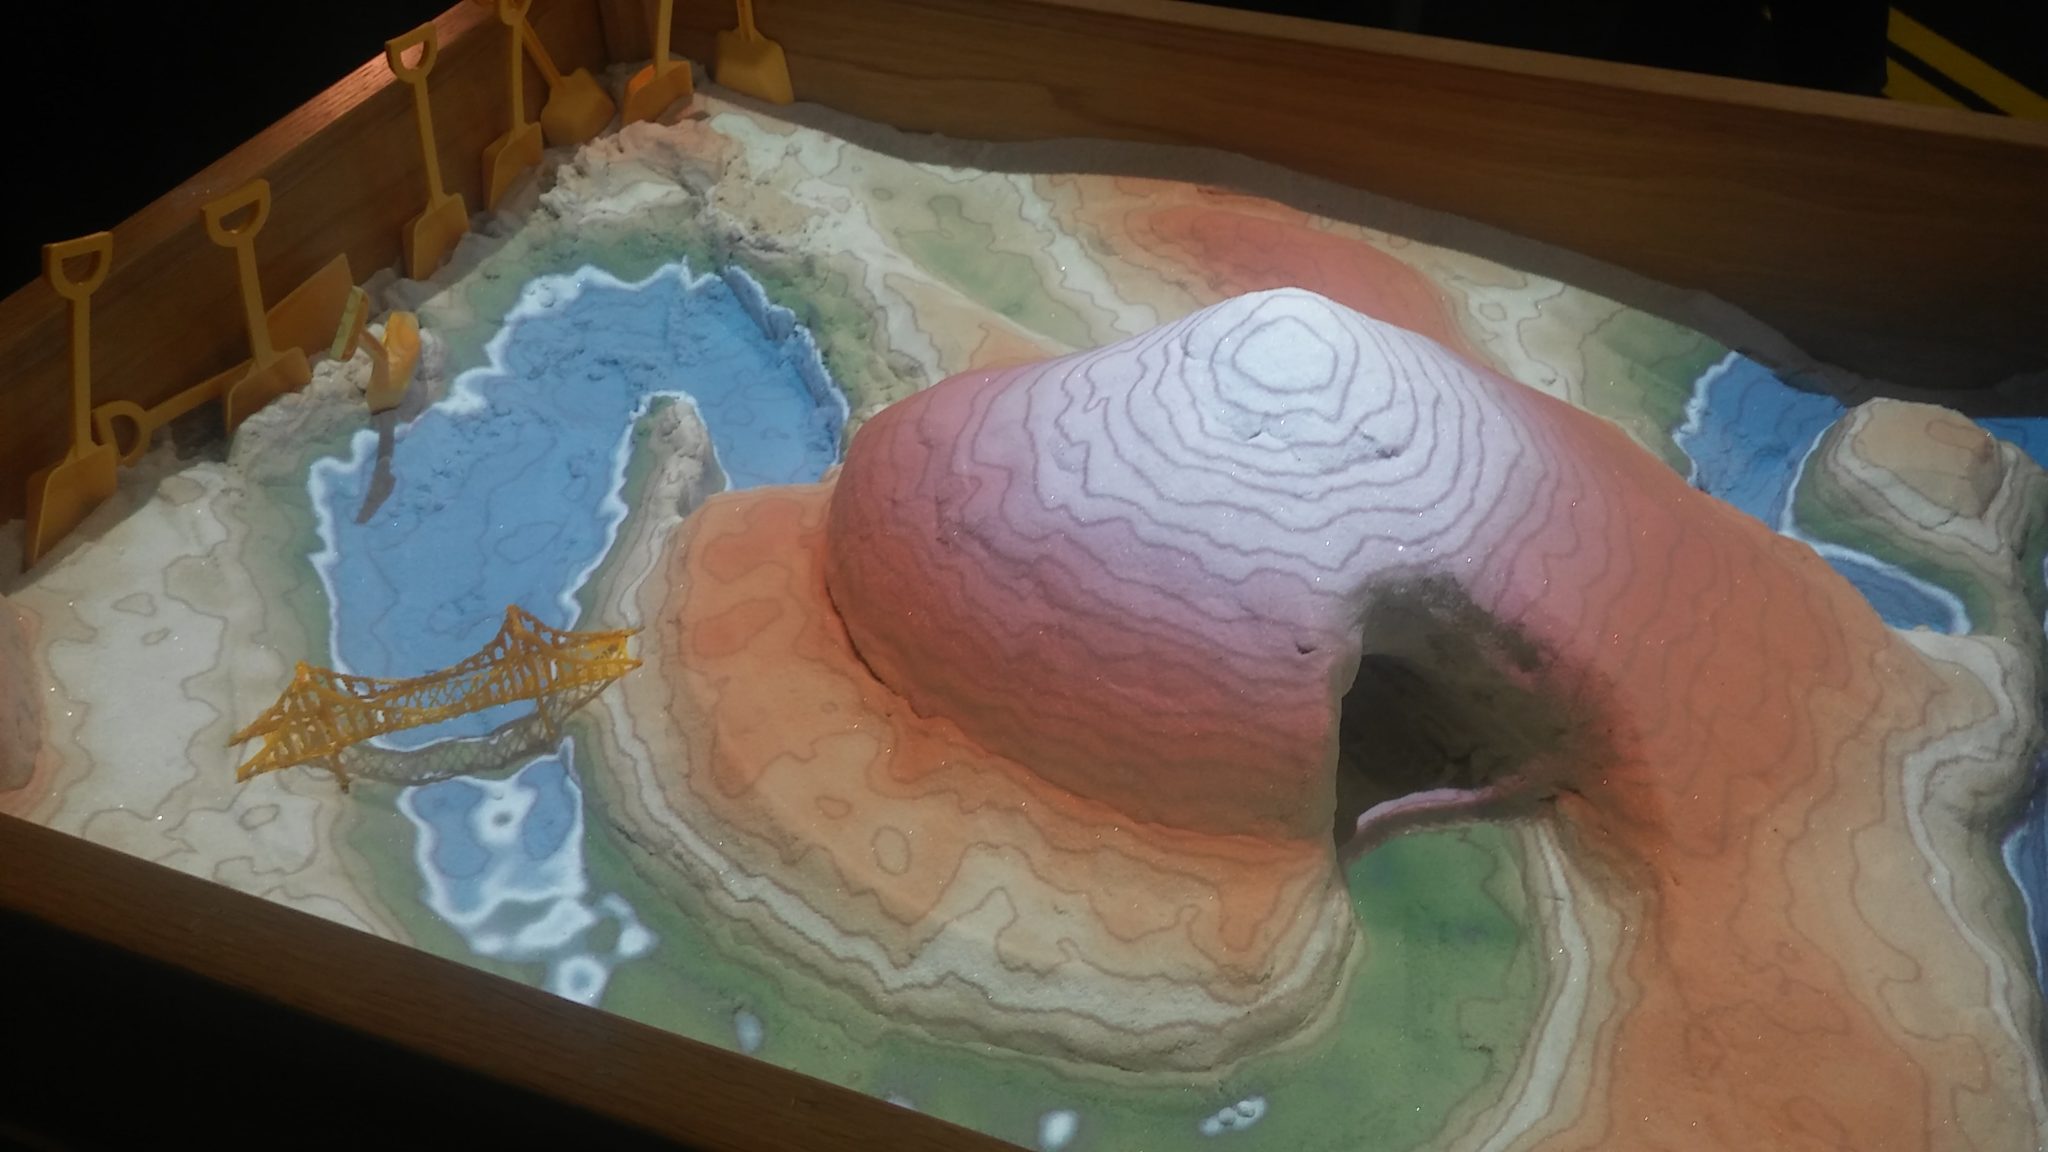
Steve’s bridge was so good we had to use it.
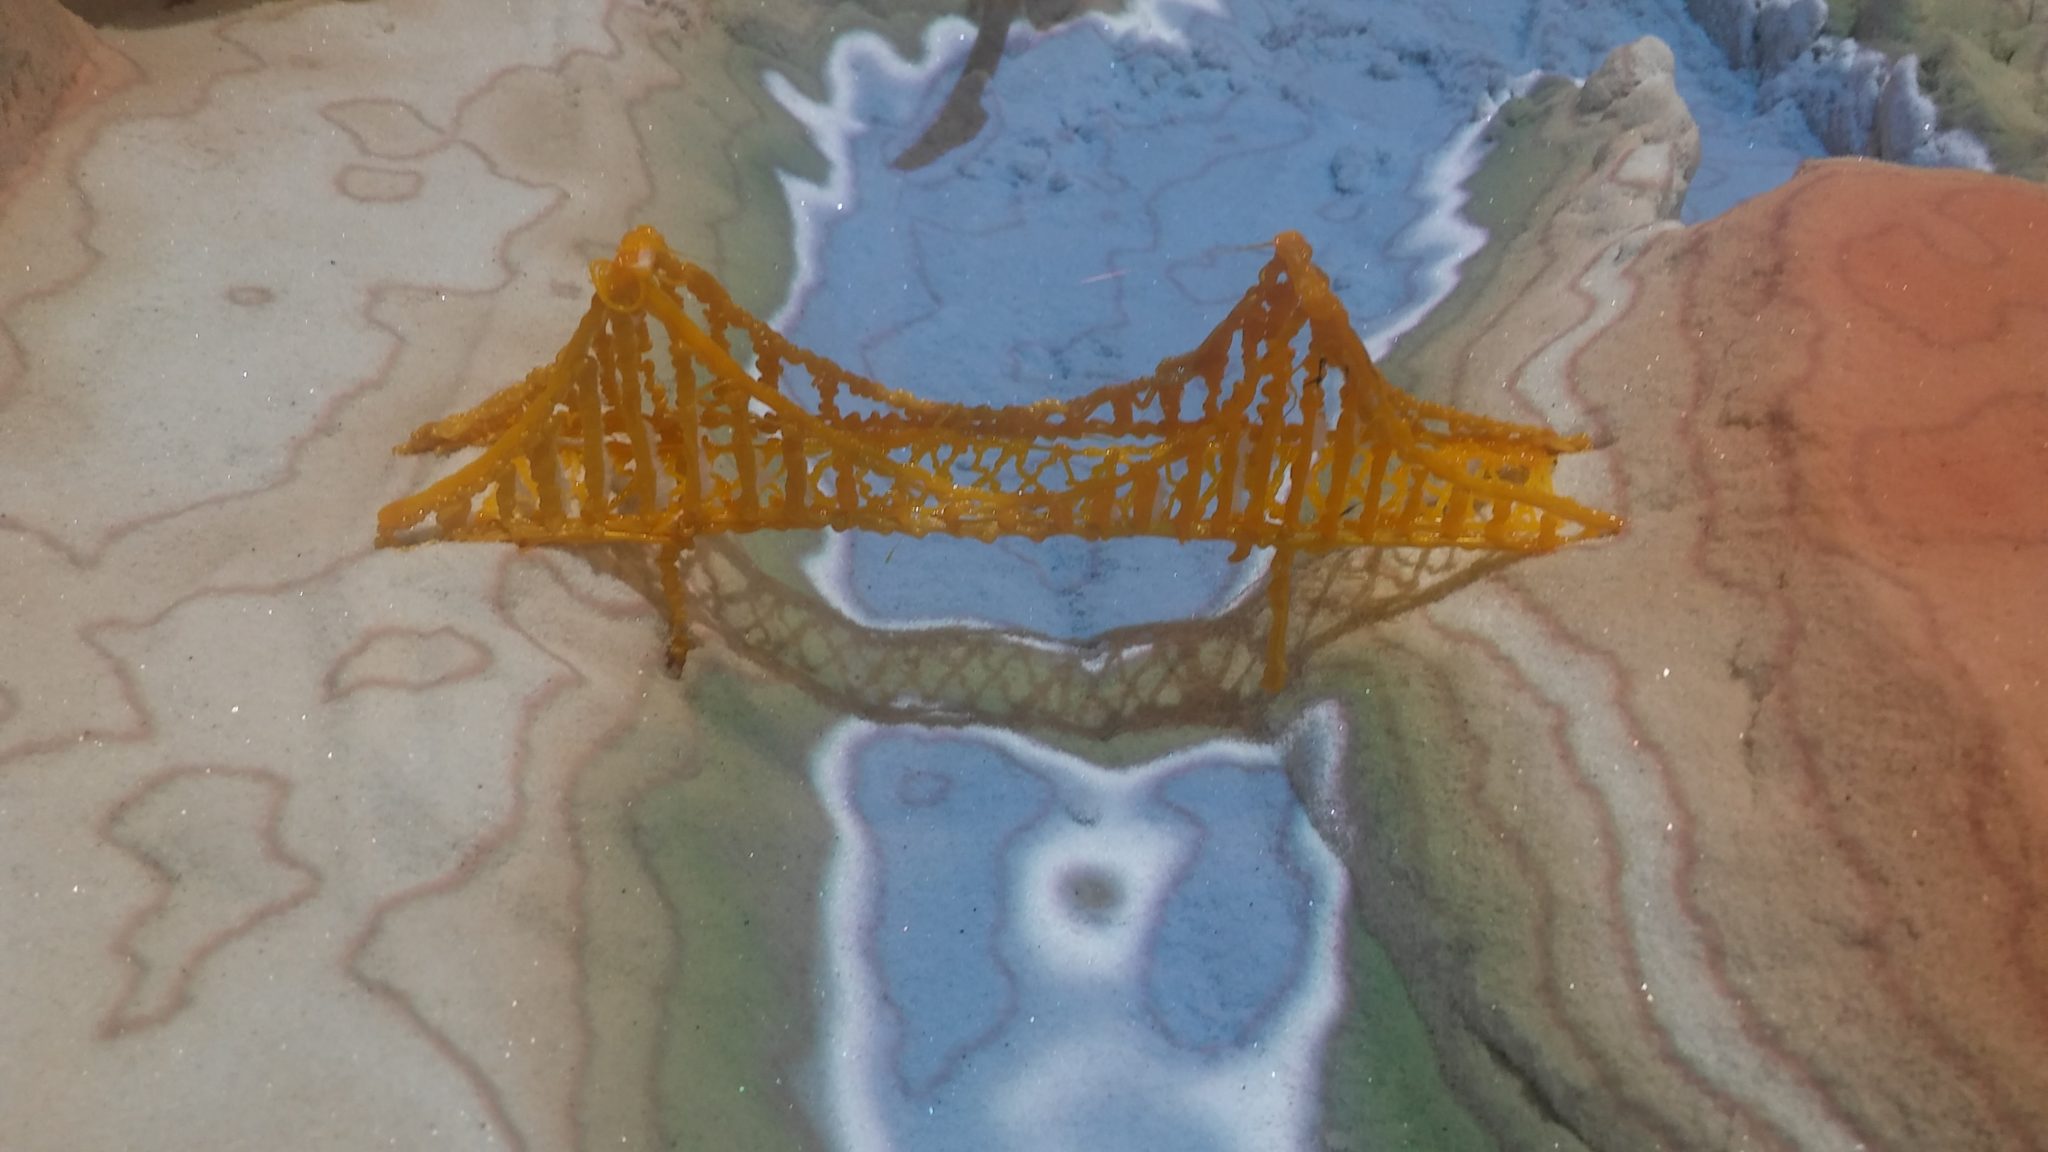
It looked even better up close.
On August 31, 2016, Utah GIS users lost their connection to the State of Utah ArcGIS networks. After many long hours of making phone calls and exerting technical genius, Meridian’s GIS Project Manager Adrian Welsh has a working alternative to help Utah GIS users access this crucial data. The following are his instructions.
How to utilize parcel data from the AGRC with ArcGIS Pro
If you have used ArcGIS Desktop (ArcMap) for utilizing Parcel data from the AGRC (Automated Geographic Reference Center), then you have probably come across this article describing the deprecation of SDE server connections (here: http://gis.utah.gov/sde-application-server-connects-deprecation/). It is past August 31, and that means the server connection is gone (for GIS users outside the State of Utah networks). While the above article goes on to show how to utilize AGRC’s GIS data from ArcGIS Online into ArcMap, this blog post will show you how to utilize this online data (particularly Parcel data) in ArcGIS Pro.
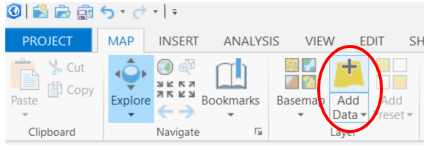
Open up ArcGIS Pro and load a new map (or use an existing one). Under the Map tab at the top, click on the Add Data button:
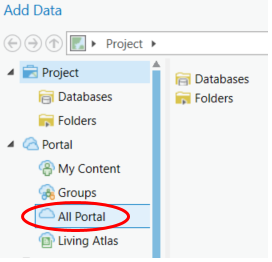
On the left hand side of the Add Data dialog box, look under the Portal category and choose the All Portal option:
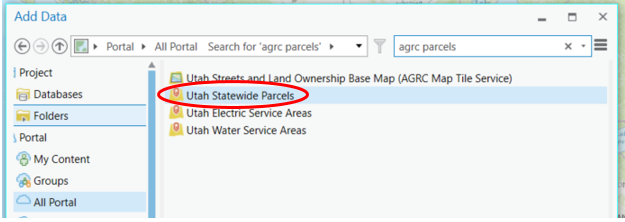
In the search box, type in “AGRC Parcels”

Choose the newly created “Utah Statewide Parcels” Feature Layer and then click on Select:
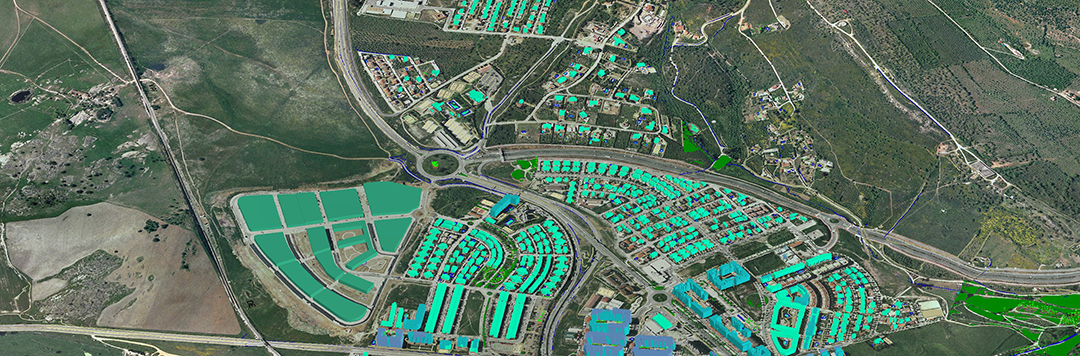
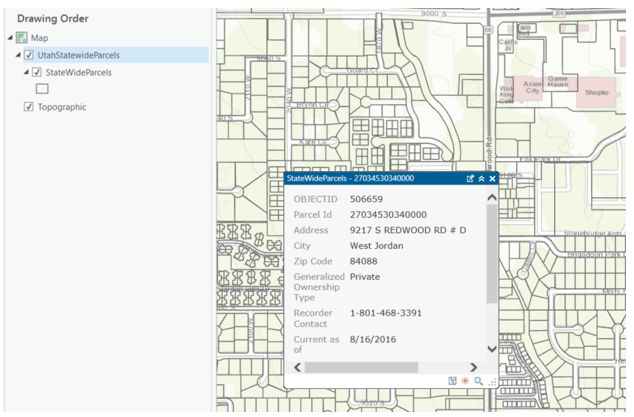
Because there are hundreds of thousands of Parcels in the State of Utah and this layer contains them all, it is a good idea to zoom in to a specified location in order to minimize drawing time. While this is different than how it used to be (each county was once its own layer), you can now utilize the entire state at one time which is helpful when your data spans across counties.
After it is loaded, you can treat it like you would treat your regular data:
One additional note about adding ArcGIS Online data: Oftentimes it is unclear what kind of data is being displayed in the Add Data dialog box. Here is a tip on how to know what the data types are. Open the Add Data dialog box, click on All Portal in the left hand side, type in SGID (or whatever) into the search box, then click on the three lines icon at the top, and choose Gallery:
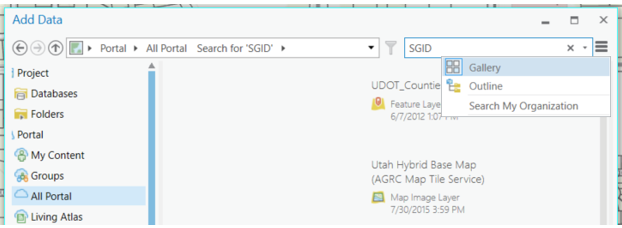
In the list of layers, now you can see what the data types are (examples include: layer, feature layer [hosted or otherwise], map image layer, layer package, tile layer [hosted or otherwise], imagery layer, etc.).
Special thanks to Matt Peters at the AGRC for getting this layer put together.
Meridian Engineering provides civil engineering, land survey, right-of-way acquisition, & construction management services to Utah and the surrounding regions.

© 2019 Meridian Engineering, Inc.